Table of contents
- What is drill-down and how do I use it?
- What is included and not included in the drill-down view?
- How to request additional information to be included in the drill-down view
- What do the field prefixes mean in the Full Data view?
- Drill Down vs. View Data in Tableau
What is drill-down and how do I use it?
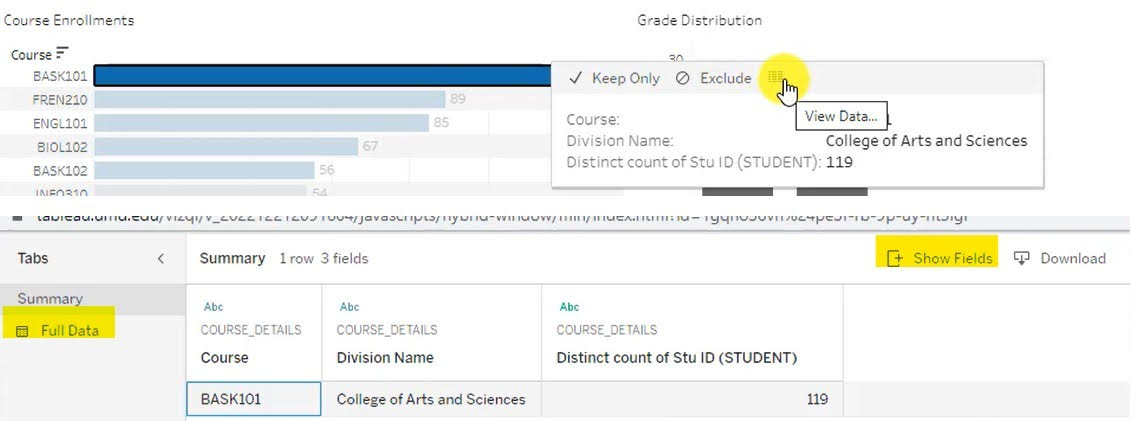
- Click on a cell in the report.
- Click on the View Data icon on the right-hand side of the box that appears.
- Click on the Full data tab in the new window.
- Click on the Show fields box.

What is included and not included in the drill-down view?
Drill-down includes two sets of information. All users can view and download a summary of the fields they selected. Authorized users only can access a second tab of information called "Full Data" that displays all the underlying data that was used to generate the report, beyond what is displayed on the report.
Notes:
- The drill-down view only shows you information for the fields, columns, or rows you selected.
- The Full Data view is not filtered by college, department, or other criteria. If you have access to student data, for example, you will be able to see the underlying student data for a given report for the entire university in the Full Data view.
- The Full Data view does not include every conceivable piece of information on a particular topic. For example, if student names were not needed to generate a particular report, student names may not appear in the full view.
- You may need to click Show fields
 in the Full Data view to see additional information.

How to request additional information to be included in the drill-down view
What do the field prefixes mean in the Full Data view?
Most fields use the name drawn from the original warehouse field. In addition, the following prefixes are used:
- TXT_ – This prefix indicates that the field was typed in directly by the report writer, and not drawn from any system.
- CALC_ – This prefix indicates that the field is calculated by the report writer based on other data.
Drill Down vs. View Data in Tableau
Due to an unfortunate naming coincidence, Tableau also has a feature called "Drill Down" that allows you to split a year heading, for example, into quarters, and quarters into months. This is generally not recommended, as it can crowd too many columns into a report that was only designed to show 5-10 year columns at a time, and may show date slices that do not have any data associated with them.

